Why Meta Ads Manager Overstates Campaign Performance
Meta's attribution system counts the same conversion multiple ways, inflating reported performance.
- Written by
- Daniel PrzybylskiStaff Writer, Measurement
- Published
- October 9, 2026
- Reading time
- 10 min read
- Sources cited
- 2 sources ↓
What this covers
Open Ads Manager after a campaign closes, then open Shopify or GA4 for the same date range: the two reports will not agree. Meta's dashboard has always shown more conversions than third-party analytics tools record for the identical campaigns, and the gap is the predictable output of how Meta's attribution system is built. Meta has acknowledged the mismatch directly, noting that many third-party platforms primarily attribute only to website link clicks, and that this difference in what counts as a "click" conversion produces the inconsistency advertisers see between Ads Manager and outside reporting tools. That divergence has eroded confidence in Meta's reporting, muddied budget decisions, and made cross-platform benchmarking unreliable, because the practical consequence has been budgets steered by figures that overstate what Meta's ads actually caused. The rest of this piece explains why that gap exists and what closes it.
How broad click-through attribution inflated conversion counts before March 2026
The gap originates in how Meta used to define a click. For years, click-through attribution counted any click on any element of an ad, not only clicks that sent someone to a destination, so a like, a save, a share, a comment, or even an image expansion could generate a reported conversion with no website visit attached to it. Meta structured its attribution this way intentionally and documented "click" to mean any click on the ad unit, so this was not a bug sitting quietly in the system. It was a design choice, and the gap between what advertisers assumed "click-through" meant and what it actually measured produced a persistent, systematic inflation in Meta's click-based conversion metrics relative to every third-party tool measuring the same traffic.
What the March 2026 attribution redefinition changed
On March 3, 2026, Meta published "Simplifying Ad Measurement for a Social-First World," announcing that click-through attribution would now require a click that actually sends the user to a website, app, lead form, or other destination. Likes, shares, saves, and comments no longer qualify as click-through events, which closes the specific mechanism described above. But the social engagement interactions that used to inflate click-through conversions did not disappear from Meta's measurement system; they moved into a new category called engage-through attribution, which captures non-link engagements (likes, shares, saves, comments, profile visits) followed by a conversion, and which is on by default for campaigns optimizing toward website or in-store conversions. Accounts that watched their reported conversions fall after March 3 were not watching a performance decline; they were seeing their numbers as they had always actually been, with the non-link inflation stripped out of the click-through column and relocated to a narrower, separately labeled bucket.
View-Through Attribution and Default Window Settings as a Second Layer of Inflation
A second, independent mechanism operates beneath the click definition entirely, in every account running on Meta's default settings, and it produces its own layer of inflation separate from the definition change. That default combines seven-day click, one-day engage-through, and one-day view simultaneously, so an ad impression someone scrolled past without clicking or engaging can still claim credit for a purchase made the next day. The mechanism compounds across channels in a direct, mechanical way. The window setting does more than shape what gets reported after the fact; it tells Meta's algorithm what to optimize toward while the campaign is still running. A one-day view window is especially generous during high-traffic periods, when large audiences see an ad and anyone who buys within twenty-four hours can be credited to it, whatever actually drove the purchase.
Why the same conversion gets counted multiple times
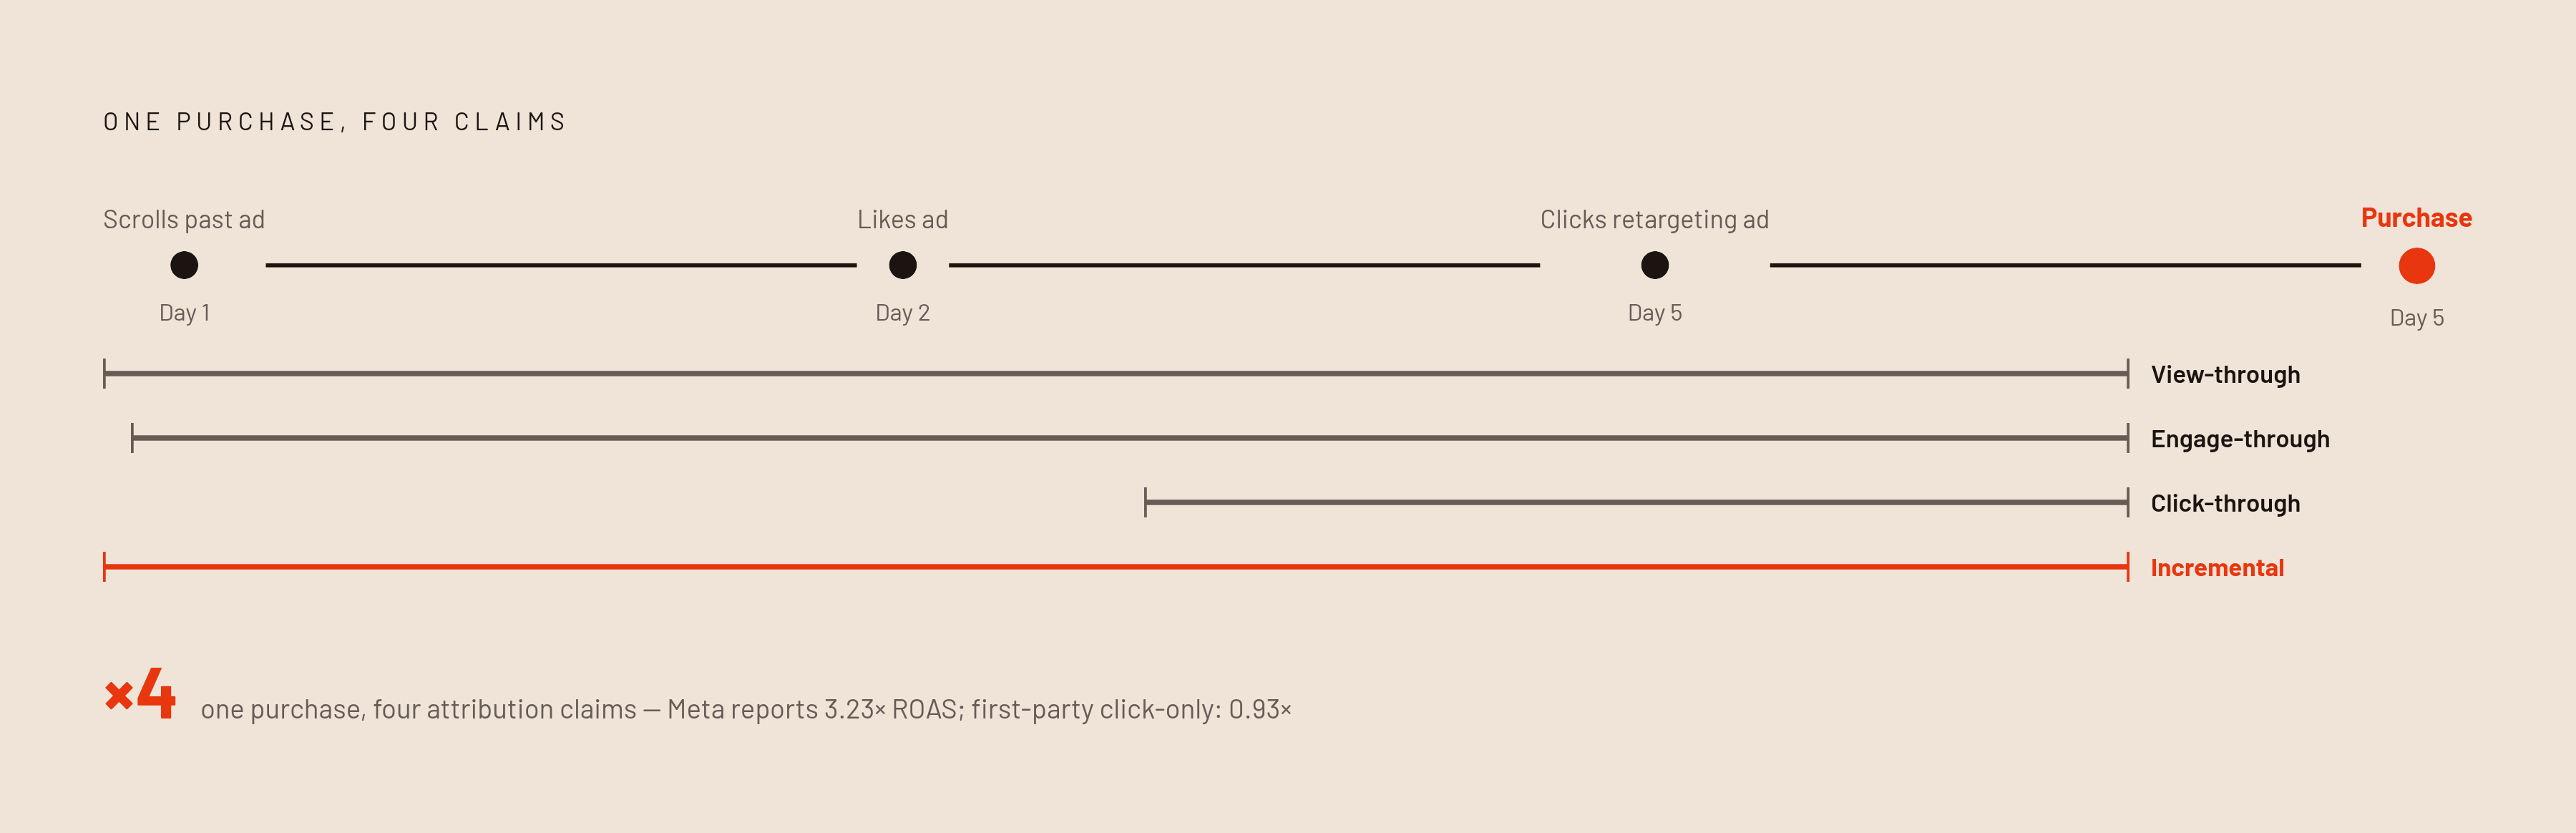
Meta now counts conversions across four distinct attribution types: click-through, engage-through, view-through, and incremental, and treating them as a single unified number is one of the fastest ways to overstate campaign performance. Because a single purchase can satisfy the criteria for several of these types across different ad sets at once, Meta's aggregate reported conversions can exceed the number of actual orders a business placed. The scale of this gap is measurable in individual accounts: on one account, Meta reported a 3.23x ROAS while click-only first-party attribution found 0.93x, a difference that traced largely to conversions Meta credited without any verifiable click behind them. That figure describes one account, not a universal constant, but it shows the direction and the rough magnitude of what overlap alone can produce.
How modeled conversions hide inflation inside the dashboard
A fourth mechanism operates beneath the first three, and it is the one that makes the other three hardest to see. A portion of the conversions Meta reports are not directly observed events but statistical estimates, and Ads Manager presents modeled and measured conversions identically, with no confidence interval and no label distinguishing one from the other. Meta's Conversions API, known as CAPI, was built to close part of the tracking gap by sending conversion events from the advertiser's server directly to Meta, bypassing the browser. When CAPI is absent or misconfigured, Meta leans more heavily on modeling to fill the resulting void. The quality of that matching is captured in a metric called Event Match Quality, scored from 0 to 10, and practitioners generally target a score of 7 or higher for purchase events; below that range, a growing share of what the dashboard reports as a precise, observed number is in fact modeled. Modeled conversions carry a second, quieter problem: they get revised retroactively as more data comes in. A campaign can show a strong ROAS on day three and a noticeably weaker ROAS on day seven, once Meta's measurement system reconciles click and view data behind the scenes, which creates an illusion of real-time precision that the underlying numbers never actually had.
Retargeting and High-Demand Periods Concentrate the Four Inflation Mechanisms
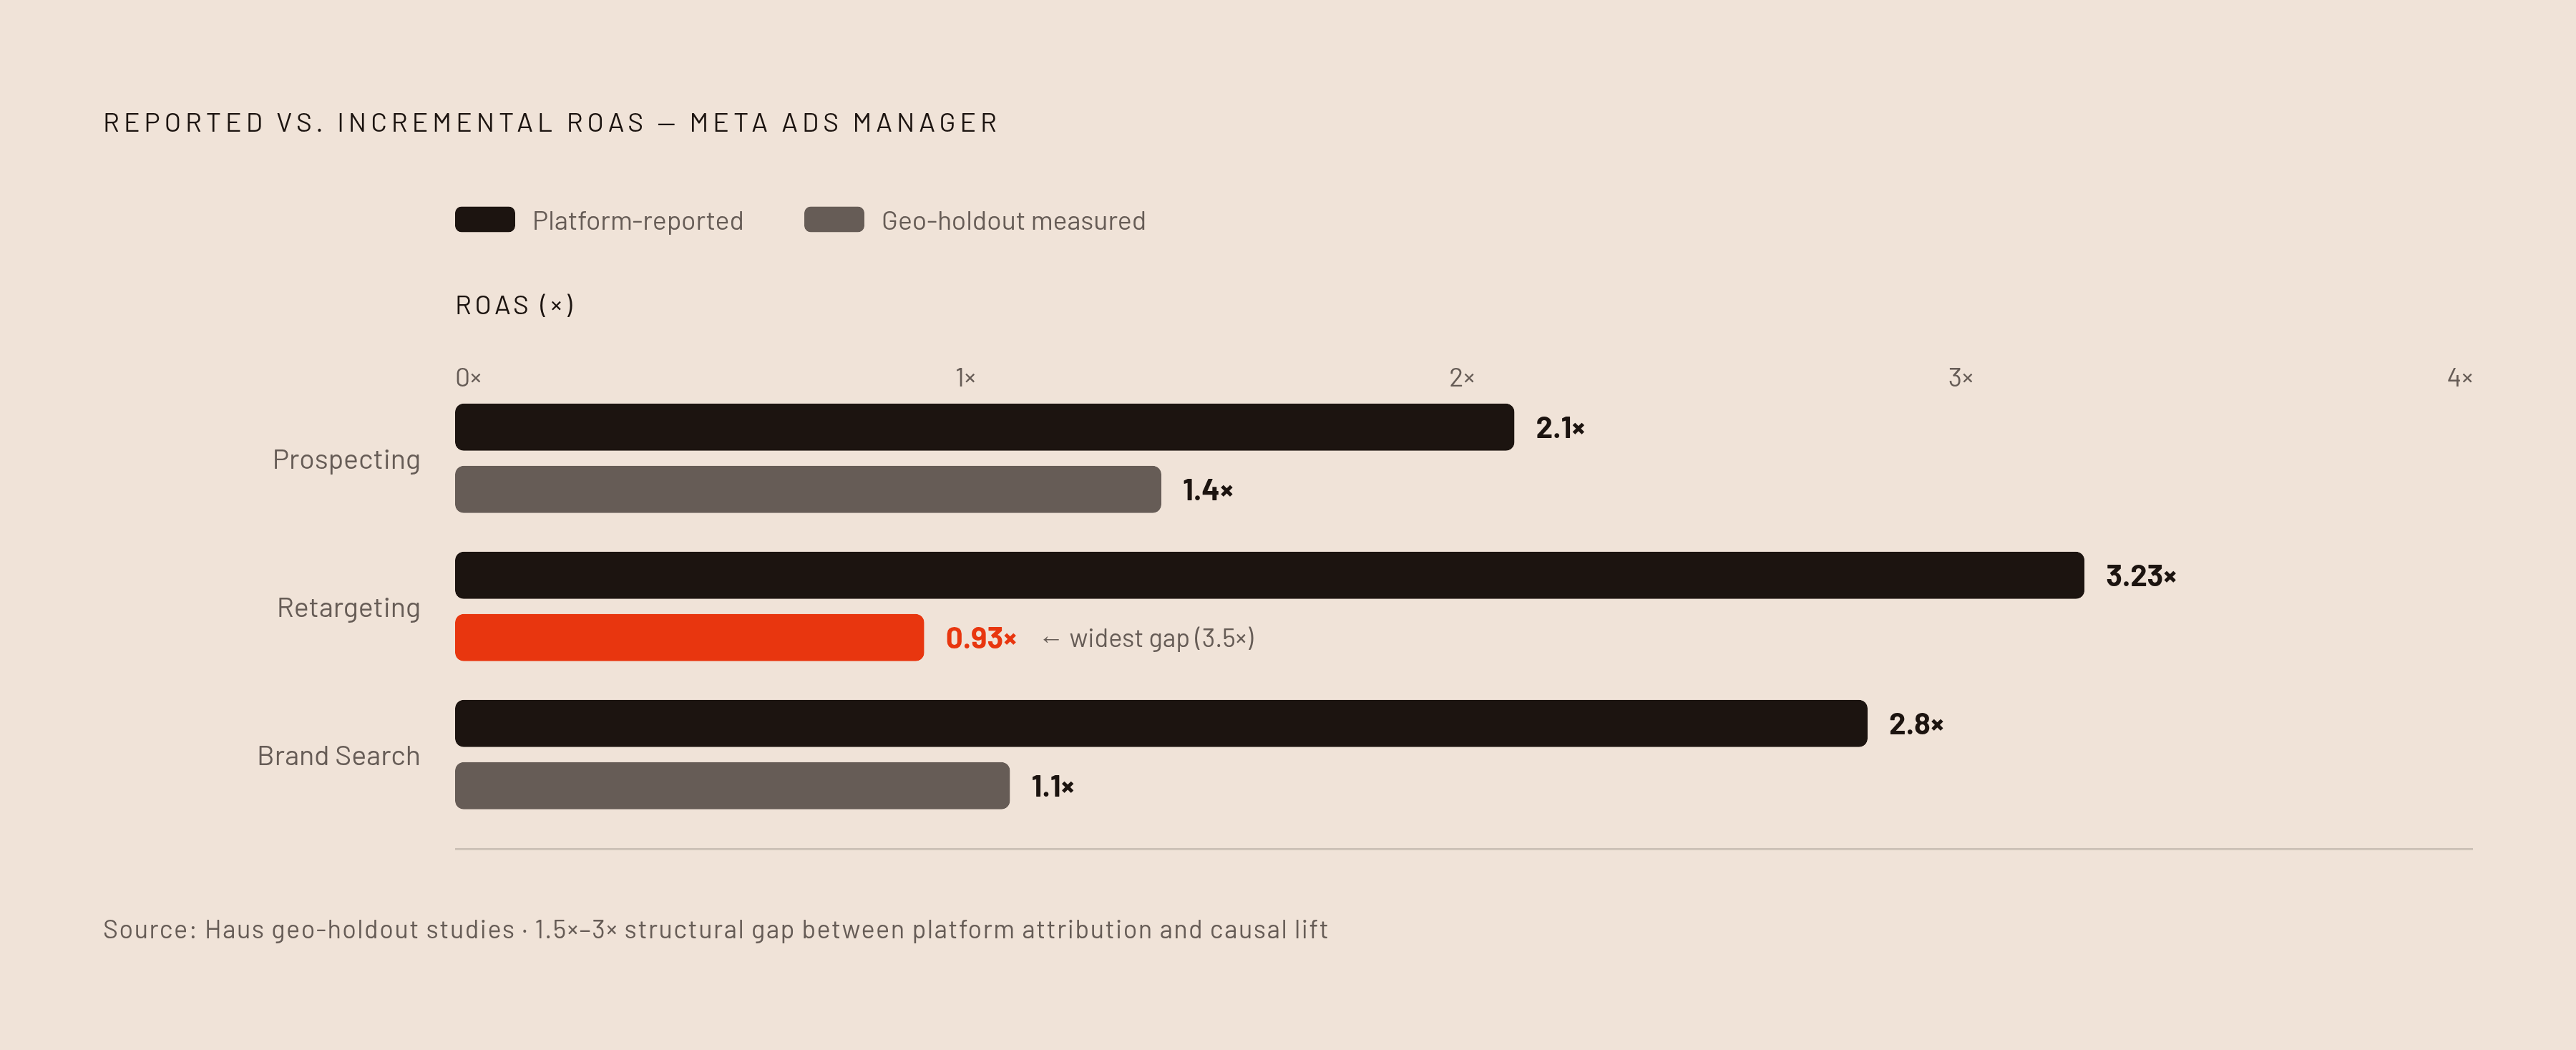
The four mechanisms rarely operate in isolation. They converge hardest on retargeting campaigns aimed at warm audiences; those campaigns report the highest ROAS anywhere in Ads Manager and carry the widest gap between reported and real performance. Shoppers who decided back in October that they would buy from a given brand on Black Friday will do so whether or not they see an ad that morning, and if they happen to scroll past one of those ads on the way to checkout, Meta can still count the resulting order as a conversion it caused. Geo-test results published by Haus put the gap between platform-reported ROAS and measured incremental ROAS at 1.5x to 3x, and that gap is widest on brand search and retargeting, precisely the placements that look strongest inside the dashboard. The compounding here is structural rather than seasonal: view-through claims the impression, engage-through claims the save or share, click-through claims the final link click, and modeling fills in whatever gaps remain from iOS tracking restrictions, all layered onto a buyer who was likely to convert regardless. BFCM 2026 is the first holiday season that runs under the new attribution rules, so if an account shifted from the old seven-day click plus one-day view combination into the narrower definitions Meta introduced during the year, its year-over-year comparisons against 2025's Black Friday numbers are not directly comparable.
Why year-over-year comparisons in Ads Manager are unreliable
The mechanisms described above don't just inflate single-period numbers; they corrupt comparisons across time. If an account ran on seven-day click plus one-day view for the first quarter and switched to one-day click for the second, the reported ROAS will look like it dropped 30 to 50 percent even if nothing about the business actually changed. As of January 12, 2026, Meta's Ads Insights API stopped returning seven-day view and twenty-eight-day view attribution windows; the one-day view and one-day engaged-view windows remain available, but if a report pulls historical data that included those longer windows, it now has a structural break sitting inside it. A related error appears across accounts rather than across time: comparing Account A running on seven-day click against Account B running on one-day click compares two different measurement systems, not two different levels of performance. The real cost of all this showed up in how advertisers reacted to the March 2026 redefinition. Many who saw conversions fall responded by adjusting creative, broadening audiences, or cutting budgets, treating a measurement change as though it were a genuine business decline, and optimizing against a number that had simply been redefined underneath them.
What each attribution source measures
Meta Ads Manager, Shopify, and GA4 are each measuring something real about the same sale, but they are measuring different things, and the resulting gap between them is diagnostic information about how a given sale was touched across channels. Meta Ads Manager credits any conversion that falls inside its attribution window, including view-through and engage-through activity, so it tends to overstate performance by claiming sales that other channels did real work to close. Shopify, by contrast, credits each order once, to the last click before checkout, which tends to understate Meta's contribution because it rewards only the final touch in a longer path. Over-attribution and under-attribution exist side by side within the same account at the same time, in different segments: view-through and retargeting line items tend to overstate performance in Ads Manager, while iOS-heavy prospecting line items understate it there, because conversions from iOS users who opted out of tracking often never appear in Ads Manager.
Standardizing attribution settings for reliable account comparisons
Most of the comparison errors described above are preventable, and the first corrective step doesn't require a new tool. It requires standardizing the settings already sitting inside Ads Manager. For most direct-to-consumer products, a seven-day click window with no view attribution is the appropriate baseline, run alongside a Marketing Efficiency Ratio calculated as total revenue divided by total ad spend across every channel, not just Meta. The right window depends on the product and the campaign goal. A one-day engaged view window belongs to video and Reels campaigns where engagement itself is the primary signal being tested, and it requires fifteen seconds or more of watch time before it counts. None of this is retroactive: changing a window going forward does not revise past data, so any window change needs to be documented with a date attached, and any performance analysis crossing that date should be treated as structurally non-comparable. If you settle these choices account-wide, every other measurement improvement that follows means something on its own.
How incrementality testing separates conversions the ad caused from conversions it merely witnessed
Attribution windows determine which conversions get counted. They say nothing about whether the ad actually caused them, and for retargeting campaigns in particular, that distinction is where most of the over-reported ROAS described earlier actually lives. In April 2025, Meta quietly rolled out Incremental Attribution inside Ads Manager, and it is built on a fundamentally different model than the other three attribution types. Rather than counting every conversion that falls within a time window, it uses machine learning to estimate which conversions were actually caused by the ad versus which would have happened regardless. That's a meaningful step forward, but Meta's own Incremental Attribution is still Meta modeling Meta's own campaigns, so it works as a step in the right direction, not as independent verification of anything. External geo-holdout testing fills that gap, because it provides a check that does not depend on Meta's own modeling assumptions. Geo-holdout results published by Haus show the gap between platform-reported ROAS and measured incremental ROAS running from 1.5x to 3x, widest on retargeting and brand search, the same placements identified earlier as the point where all four inflation mechanisms compound most heavily. For incrementality testing specifically, a one-day click window is the cleanest signal to run alongside a holdout test, since view-through conversions carry too much noise from organic purchase intent to isolate what the ad itself contributed. The practical question for most accounts running meaningful retargeting spend is no longer whether to run an incrementality test at all, but how to make that testing a continuous program rather than a one-time check.
Building a measurement stack that accounts for each inflation mechanism
The four mechanisms traced through this piece are definition, window, overlap, and modeling. Because they operate independently of one another, closing the gap between what Meta reports and what a business actually earned requires a layered response rather than a single setting change or a single new tool. The definition layer gets fixed by confirming that click-through attribution is set to link clicks only and by deciding, for each campaign type, whether engage-through should be on or off. The window layer gets fixed by standardizing on a single window, a seven-day click window for most DTC accounts, documenting the date of any change to that setting, and using Meta's Compare Attribution feature before drawing any conclusion about a shift in performance. The signal layer gets fixed by implementing or auditing Conversions API and checking Event Match Quality scores, targeting a score around 7 or higher for purchase events, since anything below that range means modeling is filling a larger share of what the dashboard presents as a precise, observed number. The causation layer gets fixed by using Meta's Incremental Attribution feature as an ongoing, real-time signal and supplementing it with periodic geo-holdout testing, producing an incrementally measured ROAS that doesn't depend on Meta's own modeling assumptions. None of these sources should be read in isolation. Meta-reported ROAS, Shopify revenue, and a channel-neutral Marketing Efficiency Ratio should be read together, because the three will never fully agree, but the pattern of their disagreement is itself diagnostic information about where the inflation is concentrated. First-party click data drawn from a store's own records, where a sale is credited only when a shopper clicked an ad and then bought, provides the cleanest available baseline for testing Meta's claimed conversions against what actually happened. Budget decisions built on that layered foundation rest on what Meta's ads actually caused, not on what Meta's dashboard claimed they caused.
Methodology & sources
- Meta Ads Attribution Settings in 2026: Best Practices
Provided details on attribution window best practices, Event Match Quality scoring, geo-holdout ROAS gap figures from Haus, and guidance on standardizing settings for DTC accounts.
- Meta Attribution During BFCM 2026
Provided the specific account-level ROAS discrepancy example (3.23x vs 0.93x), details on the March 2026 attribution redefinition, and context on BFCM year-over-year comparison issues.